Over the last few months, we have looked into where we think our General Election polling went well, and the areas we need to improve if we want to continue to make our polling as accurate as possible.
In the week before the General Election, our final poll indicated that Labour would comfortably win the election and secure a vote share of 39 per cent across Great Britain, to the Conservatives’ 24 per cent. This would have been a historic swing to Labour and an unprecedented result, even if at the time it was one of the more pessimistic predictions for Labour’s performance.
In broad terms the election result itself was close to that final poll. The Conservatives secured 24 per cent of the vote in Great Britain as in our poll. This final poll was also within one percentage point for the Reform UK and Liberal Democrat vote shares. Labour did indeed secure a historic victory, although in terms of vote share it was smaller than we predicted - Labour took 35 percent of the vote in Great Britain, 4 points lower than the final poll result of 39 per cent.

Overall we are pleased with the performance of our voting intention polling this election campaign - our first General Election and one of the most unprecedented results in recent history based on a dramatically volatile electorate.
More in Common was among the most accurate pollsters in the industry this election cycle (our precise ranking varies on how you measure this) and our MRP model held up very well in terms of predicted vote share and seats. Importantly we were pleased to be able to match our quantitative insights with qualitative information directly from voters themselves in over a hundred focus groups throughout the campaign. This allowed us to more meaningfully tell the story of the election than what could be gathered from numbers alone - and indeed the reflections from those groups often felt closer to that final result.
This blog focuses on our national voting intention polling.
As per Rule 2.3 of the British Polling Council, all of our published data tables from our voting intention polls contain the following text on the cover page:
All polls are subject to a wide range of potential sources of error. On the basis of the historical record of the polls at recent general elections, there is a 9 in 10 chance that the true value of a party’s support lies within 4 points of the estimates provided by this poll, and a 2 in 3 chance that they lie within 2 points.
For every party, our final call on the election result fell within 4 points of the actual result. As such, in one sense our final call was accurate - any error fell within the confidence interval of standard polling that occurs when reading from a sample of a few thousand survey respondents to a population of tens of millions of voters.
But given that none of our voting intention polls in the run up to the General Election underpredicted Labour’s final performance, and that this was systemic throughout the polling industry, we suspect that underlying factors relating to our methodology might have caused our overstating of Labour’s vote share, rather than simply random deviation around the mean.
Sources of potential error could come from the people we ask, what they say, and what we do with that data. This blog sets out a number of hypotheses that could explain these errors. Our aim is to be transparent about the lines of inquiry we have explored so that we can improve our methodology for the next electoral cycle and share findings with other pollsters in the spirit of fostering greater collaboration between and confidence in the polling industry.
The blog represents the first findings of our initial analysis into our polling for the 2024 election. When the British Election Study’s full dataset from this election is released we expect we will be able to test some of these hypotheses more rigorously, as at this moment we have little in the way of benchmarks to compare our final predictions with other than the final election results. As such, we will continue to work on our evaluation of our polling methodology and we will share our findings as more information becomes available. We are also looking forward to discussing this work further and collaborating with other British Polling Council colleagues and incorporating their findings and conclusions into our own work.
Hypothesis 1: Polling error was to do with our voting intention adjustment methodology
Throughout the course of the election campaign this year, much of the discussion about polling methodology focused on adjustments that pollsters were making to transform their ‘raw’ data (that is, direct answers to the question of how people say they will vote) into their final headline snapshots for how the country would vote at that point in time. In particular, many pollsters make adjustments to account for turnout (as more people say they will vote in polls than actually vote) and undecided voters.
There has always been variation in how pollsters make these adjustments, but at this election, some pollsters made more adjustments to their raw voting intention figures than in previous election cycles, and the variation between pollsters’ methodologies was much larger than it ever has been. For many pollsters, this experimentation paid off - JL Partners and YouGov both tried innovative methods this election and performed among the most accurate in the industry. The need for experimentation was mostly due to one specific issue: heading into the 2024 General Election, undecided voters were not representative of voters in general - they were much more likely to have voted Conservative in 2019. So simply discarding undecided voters and reallocating them potentially risked missing part of the picture.
To overcome this, we asked undecided respondents a ‘squeeze’ question - who they would vote for if forced to choose. And because many people still don’t make up their mind even when prompted in this way, we used a statistical model to estimate who the remaining voters were most likely to vote for based on how they compare to similar voters.
All this amounts to a fair amount of adjustment occurring between our raw data and our headline results - so it is reasonable to assume that a flawed assumption in these adjustments could be driving the error in our final result.
In practice, however, our voting intention adjustments had limited impact on our final results, and where our adjustments did make a difference, they tended to bring the polling closer to the real results:
Between our unadjusted weighted data and our headline figures, the Conservative vote share changed by 2.7 points, the Green Party by 1.6, and all other parties changed by less. So the adjustments did have the desired effects of removing unlikely votes (who are more Labour leaning) and exposing undecided Conservative voters. This resulted in our Labour vote share being around 1 point closer to the final result, and our Conservative vote share being almost three points closer than it otherwise would have been.
At the same time, our adjustments became less influential on final voting intention numbers towards the end of the election campaign than they did at the start. In many ways this is to be expected - reallocating undecided voters has less impact closer to an election when more people make up their minds (indeed the gap between ‘nowcasting’ and ‘forecasting’ pollsters did close as the election campaign went on, particularly with the Labour vote). It therefore seems likely that our adjustments helped bring our final poll closer to the final result and were not a major (or even a minor) cause of polling error for the major parties.
Our turnout model takes into account voters’ age because we know that younger people are less likely to vote. But in this election we underestimated the Green Party’s performance in part because many young Green voters were modelled as unlikely to vote, in line with previous elections. When the post-election British Election Study dataset is released, it is possible that we discover our turnout modelling was too restrictive on young people this election, and we will adjust it accordingly.
Of course, it is possible to argue that our adjustments were flawed because they did not do enough to bring our raw data closer to the final result. We have explored many approaches to modelling turnout and undecided voters, but on the raw data we collected no combination of adjustments is more effective. We’re also publishing our microdata from our final poll to support others investigating the same, and once we are able to draw final conclusions from the BES post-election survey we will update our methodology accordingly .
The verdict: Our adjustments generally helped expose undecided Conservative voters and quash those who said they would vote Labour but were unlikely to vote, bringing both vote shares in the poll closer to the final result. But by the time of our final voting intention poll, our adjustments had a more limited impact on the overall result, as fewer people were still undecided about who they would vote for. As such, it seems unlikely that our adjustments would be a major cause of polling error.
Hypothesis 2: Polling error was due to people making up their mind about who they will vote for at the last minute
Our final voting intention poll was conducted between the 28th and 30th June, early respondents gave their voting intentions almost a week before polling day. It is possible that in that time many people changed their mind away from Labour.
Given that our largest error was between the left-leaning parties this seems plausible - people might have made tactical decisions to vote for the Liberal Democrats, Greens or independents in the final days of the campaign as they start to pay more attention to their local candidates.
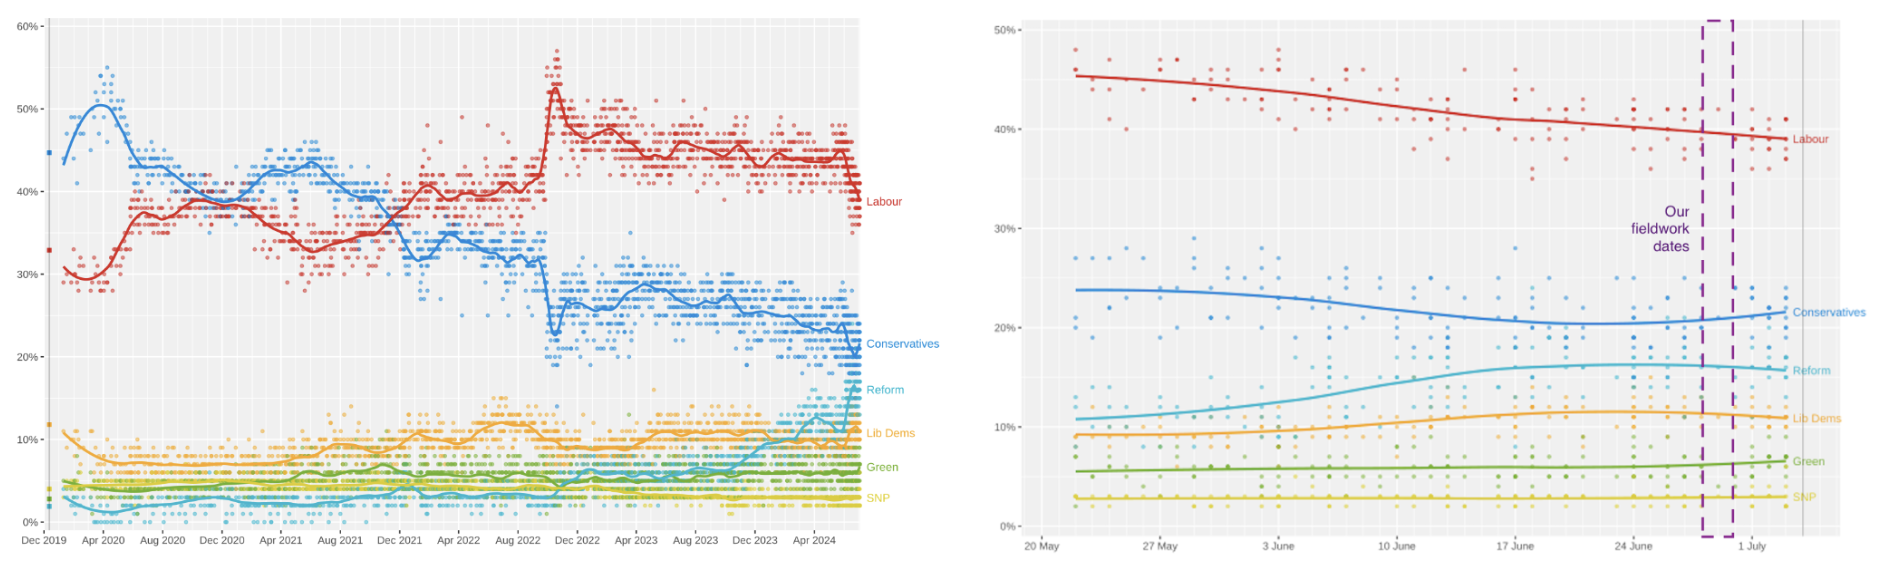
And looking at the rolling average of all pollsters throughout the election campaign we can see that almost all picked up on a significant swing away from the Labor party in the final weeks of the campaign.
Source: Wikimedia Commons
.svg)
If we extend our own time series from the day of the last poll until election day, this would project a Labour vote share of 38 per cent. So it is realistic to suggest that our early fieldwork dates might have led to an overestimation of Labour’s vote share by one percentage point.
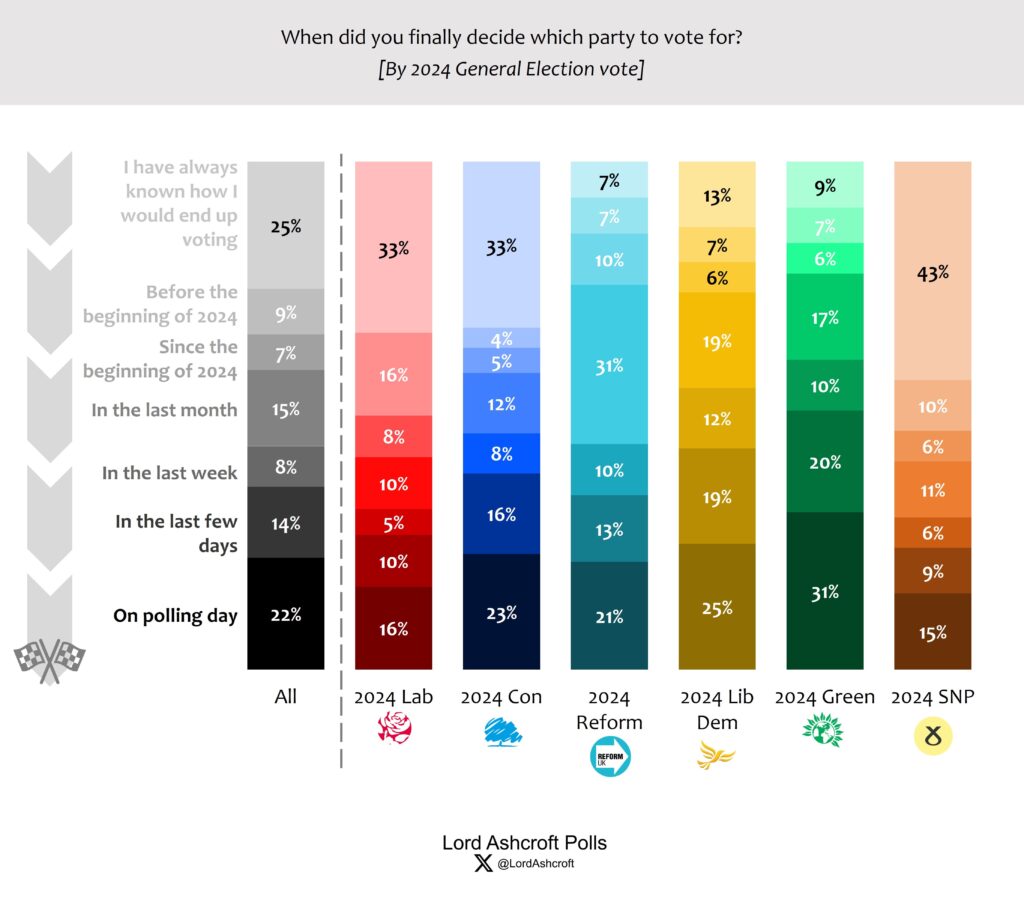
Separately, when Lord Aschroft Polls asked when voters made up their mind at the General Election, more than half of Green voters said they decided in the days before the election - which could account for much of our underestimate of the Green Party’s performance. Those who decided in the last few days or on polling day itself were much less likely to vote Labour than the average voter, and more likely to vote for one of the smaller parties. In particular more than half of Green voters said they decided in the days before the election - which could account for much of our underestimate of the Green Party’s performance.
Source: Lord Ashcroft Polls
The verdict: It is likely that some voters changed their minds between our final poll and polling day away from the Labour Party - and this could have led to an overestimation of Labour’s vote share by around one percentage point. However, this does not necessarily mean that our other sampling assumptions are free from other sources of error.
Hypothesis 3: Polling error was due to under-representing certain demographics
When we conduct polls, we recruit respondents from online panels using quotas for sex and age groups (interlocked), region, and education level to ensure we get a sample that represents the wider country, and we further weight to previous election vote and ethnicity to ensure we represent groups who might otherwise be underrepresented.
So while we know that we are accurately reflecting the country in terms of proportions of these demographic groups, it remains possible that there are other groups we do not set quotas or weight for that might be under- or over- represented in our polls. Having explored many demographic groups that could theoretically be missing from our poll, we are yet to find meaningful evidence that overstating or understating the size of a particular group drove error with our final poll results.
It is also possible that we have the wrong combinations of these demographics - for example, the right number of people over 65 and the right number of people with a university degree but too many people over 65 with a degree. In practice, however, this does not seem to happen in any way that would affect our final result - by letting the sample fall out naturally rather than explicitly weighting for it, the education/age profile of our respondents still almost exactly matches the UK population. If we re-weight our final poll to ensure that the age/sex/education profile of the UK population it makes our predictions no more accurate. When we try out different combinations of our weighting demographics, we find the same.
In fact, we think that our sampling frame was a key part of our methodology that made our results more accurate. Many pollsters do not weight by ethnicity, and that we do so may have lowered our final Labour vote share (because Muslim voters voted for Labour much less in this election than in previous elections).
More significantly, we think our age quotas helped us to better estimate the Conservative vote share accurately. The risk of setting the oldest age bracket at “65+”, is that samples miss out on the oldest respondents by not explicitly seeking them out. To tackle that we are relatively unusual in setting specific quotas and weights for 75+ year olds, which ensures that this group is properly represented (the polling inquest following the 2015 election concluded this group can otherwise be underrepresented, but at the time there was little pollsters could do about this given that before the pandemic fewer 75+ year olds were online). Given that 75+ year olds are both more likely to vote and more likely to vote Conservative this has the effect of more completely capturing the Conservative vote.
The verdict: We are yet to identify a demographic that is meaningfully underrepresented in our polls in a way that would swing our voting intention polling. It is possible that such a demographic exists but we are yet to find convincing evidence for it. Generally, the 2024 election has made us confident that we are generally weighting and allocating for the right demographics when conducting political opinion polls, although we will review our weights once again when final conclusions have been made.
Hypothesis 4: Polling error was due to an unrepresentative subsample of ethnic minority respondents
We are confident that our final poll ended up with roughly the right mix of Britain’s different demographic groups - but that does not guarantee that our samples of each demographic group accurately represent those groups.
The one area where we think this is most likely to be happening is our ethnic minority sample. We weight by ethnic group to ensure that Britain’s ethnic diversity is proportionally represented in our polling. And although we don’t explicitly weight by religion, our polls align roughly the right proportion of different religious groups across the population.
But this does not exclude the possibility, for example, that our Muslim survey respondents were not representative of the UK’s Muslim population in some other way. Some of the biggest upsets on election night were significant swings against Labour in Labour safe seats with very large Muslim populations. We knew from our focus groups that many Muslim voters were frustrated with Labour, but such a sizeable backlash did not appear in our voting intention.
It is difficult to know precisely how Muslims voted in this election - the results cast doubt on the accuracy of Muslim subsamples from online nationally-representative polls, and high-quality polling of Britain’s ethnic minority groups is challenging (the last Ethnic Minority British Election Study was conducted in 2010). But the results in constituencies with large Muslim populations suggest our voting intention overestimated Labour’s vote share among this group.
Polling errors with Muslim voters cannot explain all of the polling miss at this election. In an extreme scenario where half of those Muslims we projected to vote Labour instead voted for an independent candidate, this would have taken our national Labour vote share a percentage point closer to the result.
While the impact on national voting intention predictions may not be significant enough to explain all voting intention overprediction for Labour, it seems probable that some polling error occurred with Britain’s Muslim population. This is likely because online panels include too many Muslims who are second- or third-generation immigrants, and too few who were born outside of the UK compared to the population as a whole. Conducting polls in English also certainly excludes some Muslims from taking part in opinion polling, and the same holds for many other groups.
This suggests that Muslims on British market research panels such as those used by pollsters could be unrepresentative of the wider Muslim population.
As a pollster who draws on a range of external market research panels, we think this is important to correct. We have opened conversations with our panel providers and are exploring ways to recruit more representative Muslim panellists, and are investigating steps that we can take including interlocking our existing ethnicity weights with country of birth, religion or religiosity. We will also be consulting with EDI experts and Muslim groups to explore developing new methodologies for more accurately measuring Muslim public opinion
Errors relating to polling of Muslim voters are fairly easy to identify because Britain has a large enough population of Muslims to meaningfully change national polling predictions. But we also suspect that other minority groups are also poorly represented in national opinion polls - such as Hindu voters (who seem to have swung towards the Conservatives), first generation immigrants, and those without a permanent address.
The verdict: The Muslim subsamples in UK opinion polls were clearly not representative at this election. But a significant Muslim polling error is not enough to explain the full polling miss - even if we were 50% off on our Muslim result, Labour’s lead would only fall by a point nationally, but this is nonetheless still significant and could be further exacerbated if similar patterns of poor representation were found among other ethnic minority voters. Improving polling of British Muslims and other minority groups must be a priority - not least because it is important that their views are properly represented in national opinion polling.
Hypothesis 5: Polling error was due to the ‘sort of people’ recruited into online nonprobabilistic panels
Errors with our Muslim subsamples and last-minute voting decisions may explain about half of the 4 point polling error - it remains possible that the remainder lies with the type of people on market research panels more generally.
For a poll to perfectly represent a population, everyone should have the same random chance of being in the sample. In practice, the chance of someone responding to a survey or being recruited to an online panel (such as the ones used for most opinion polling) is not entirely random. In some panels, any member of the public can sign up to receive surveys in return for a small cash reward so long as they meet basic entry requirements (sometimes these are called “open” panels), and in others panellists must be “invited” for example through a mass mail-out (a “closed” panel). But in both cases, issues of selection bias remain because certain types of people are more likely to sign up than others. (It is worth noting that Verian achieved one of the most accurate final polls of this year’s election with a ‘random probability’ panel, where issues of selection bias are reduced.
Part of the issue is one of incentives. Panel companies and pollsters who run their own panels care deeply about the quality of their panellists, and invest millions in ensuring their panels are free from bots and bad actors, while aiming to recruit a group of people that represent the breadth of public opinion.
But they are also incentivised to recruit large numbers of panellists in the most cost effective manner. The typical advert to sign up to a panel might contain language such as ‘WANTED, YOUR OPINION!’, ‘Your chance to have your views in the news!’, ‘Share your opinions to get rewards’. It is difficult to prove, but it is easy to speculate that such adverts might be more likely to attract more politically engaged or overly opinionated panellists. An advert saying ‘You don’t need to have strong opinions, we’d like you to take our surveys anyway’ might not attract as many sign ups, but could appeal to respondents with slightly different perspectives.
It is possible to get around the specific problem of over-engagement by weighting the sample to match a large random probability poll such as the British Election Study. On a simple zero to ten scale of self-described political engagement, online panels that we have tested tend to have slightly more respondents at the extreme ends, and fewer in the centre, although we are already reasonably close to the numbers in BES because of our age and education weightings.
We did not ask this specific political engagement question in our final voting intention poll. As such we cannot know how weighing by political engagement would have changed our final voting intention. But when we have weighted by political engagement in the past it has mostly had the effect of reducing implied turnout rather than changing overall voting intention scores in a meaningful way.
Certainly, selection bias occurs when recruiting to online panels, but much of this can be mitigated with careful weighting and sample frame design. There is no evidence from this election that phone polling performed better than online panels in the final result. We remain convinced that online polling in general is a robust methodology for accurate quantitative opinion research - with the potential for greater reach than telephone polling and an ability to be more reactive than is possible with face-to-face fieldwork.
The verdict: It is a perennial challenge for the polling industry that online surveys may attract specific types of people more than others and phone polls have their own challenges. There are some tweaks we can make to ensure our panel is not overly engaged, but overengagement might not be the only defining characteristic of people who participate in online surveys. While this might not definitively explain the polling error on Labour’s vote share, it remains a feature of online polling that may need to be addressed.
Conclusion
Generally speaking, pollsters told an accurate account of the General Election this year, even if at points they appeared to exaggerate the scale of the Labour’s lead. It is also the case that MRP models predicted there would be a disproportionate Labour seat victory relative to their gain in votes. And a range of MRP models from More in Common, YouGov, JL Partners and Focaldata were close to the final result.
But given that opinion polls not only told the story of this election campaign, but in many cases became part of the story, it is important that the polling industry continues to improve and seek to become ever more accurate.
We were happy to have accurately predicted the Reform UK and Conservative vote shares, and the 3.9 points of error on our Labour vote share was within the confidence interval stated on our polling tables But since every pollster overstated Labour’s performance, it appears there is a wider problem with established polling methodologies that needs to be addressed, even if public opinion polling in general remains accurate.
We find it plausible that around one percentage point of this error on Labour’s vote could come from people changing their minds in the last week of the election campaign, and another percentage point could have come from unrepresentative Muslim subsamples. The rest may be explained by selection bias on online panels, random sampling error, or another unidentified cause.
In the coming months, we will continue to work to improve our methodology. When the British Election Study from this election is fully released, it is likely that we will change our weighting scheme - most likely to weight for country of birth interlocked with ethnicity, or to weight for political engagement level. We have also started early conversations with our partners about developing new experimental methodologies to measure public opinion of Britain’s ethnic minorities.
Today, we are publishing the raw micro-data from our final voting intention poll, so that others can explore their own theories relating to the poll. And when we relaunch our voting intention time series next month, we will begin releasing new micro-data once every two months alongside standard data tables, an unprecedented level of transparency that we hope will allow academics, researchers, and amateur psephologists to stress test our methodologies and explore live public opinion data in a new level of detail.
As researchers, the opportunity to ‘calibrate’ polling methodologies to an election result only comes around every few years. This election has made us confident that the decisions we make in our methodology - from using online surveys, to reallocating undecided voters, to the demographics we choose to weight for - are broadly correct and deliver accurate results. But the election has exposed areas for improvement, and have given us new lines of inquiry to work on as we continue to improve our polling accuracy.
The good news is that the polling industry continues to innovate. This election saw a wide range of methodologies tried, many for the first time and with promising results - from YouGov’s complete rethinking about how voting intention polls can be conducted with their MRP methodology, JL Partners’ SRP model, and Verian’s and Ipsos’ random probability voting intention trackers. The experimentation paid off for those who tried new methodologies, and the election results showed that pollsters will need to continue to innovate to stay on top of public opinion in the years ahead.
We hope this write-up is a useful contribution to the discussion about the accuracy of polls in this year’s election. Anyone interested in exploring this topic further would do well by reading these great write-ups from Mark Pack, Patrick English, Daniel Finkelstein, and Will Jennings. If you have any comments, questions or feedback, we’d love to hear it too - please email ed@moreincommon.com.